UI du tableau de bord - PowerBi
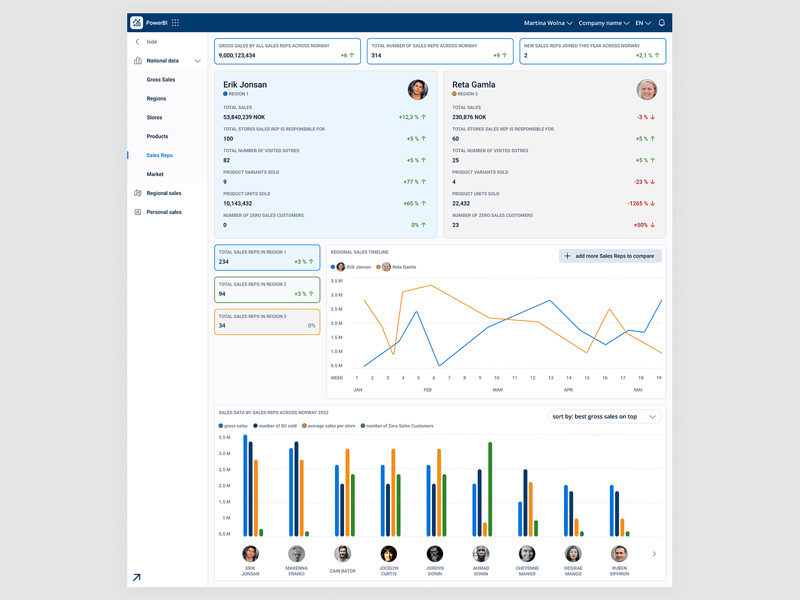
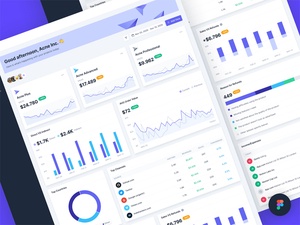
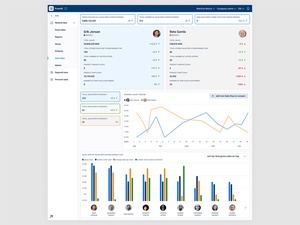
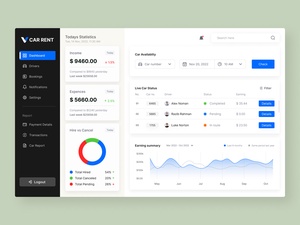
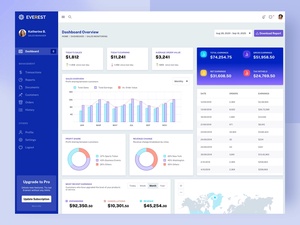
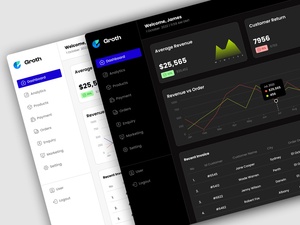
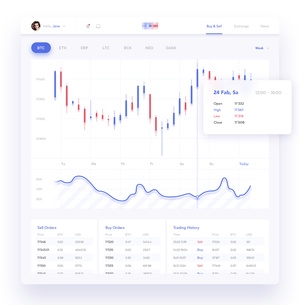
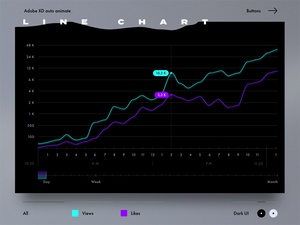
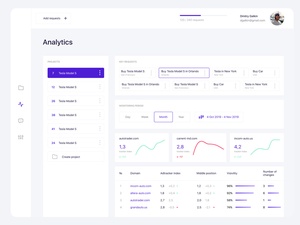
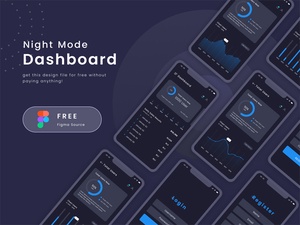
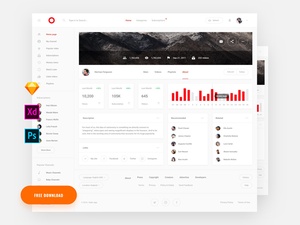
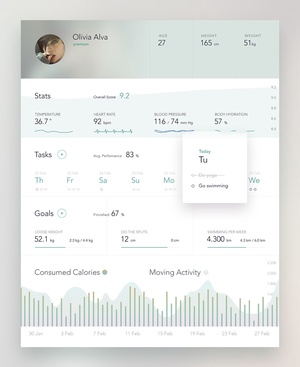
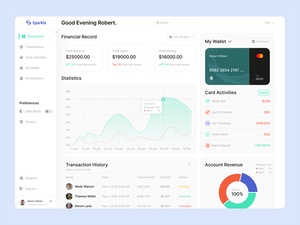
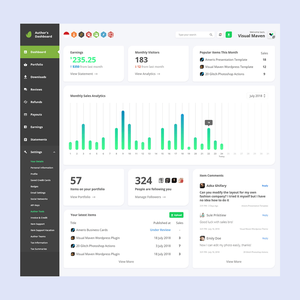
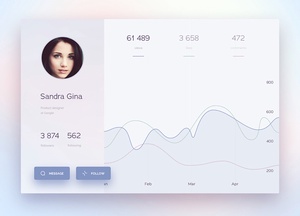
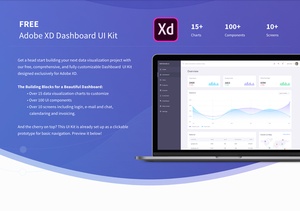
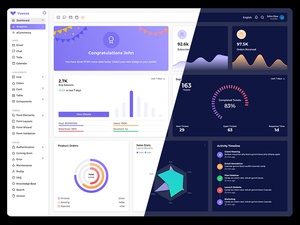
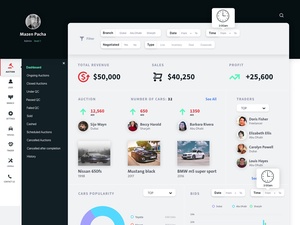
This meticulously crafted dashboard for PowerBI empowers users with the ability to seamlessly analyze and visualize intricate data sets, unlocking valuable insights through interactive charts, graphs, and essential key performance indicators (KPIs). Its intuitive interface and adaptable layout provide businesses with the tools they need to make informed decisions grounded in real-time data.
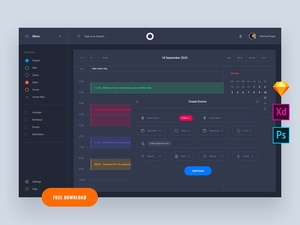
The dashboard's user-friendly design features customizable options that enable users to tailor the layout to their specific needs. Whether you want to focus on specific metrics, delve into granular details, or monitor KPIs at a glance, this dashboard empowers you to create a personalized workspace that suits your unique requirements.
With its comprehensive suite of interactive elements, the dashboard becomes an indispensable tool for data exploration and analysis. Explore interactive charts that allow you to drill down into data points, uncover patterns, and identify trends. Dive into interactive graphs that present data in visually compelling formats, making it easier to spot outliers, correlations, and relationships. Stay informed with real-time KPI updates that provide a constant pulse on the performance of your business.
This dashboard for PowerBI is not just a tool; it's a catalyst for informed decision-making. By providing a clear and comprehensive view of your data, it empowers you to make strategic choices based on a solid understanding of your business performance. Whether you're looking to optimize operations, identify growth opportunities, or navigate challenges, this dashboard equips you with the insights you need to drive success.


