Gráficos de barra 3D
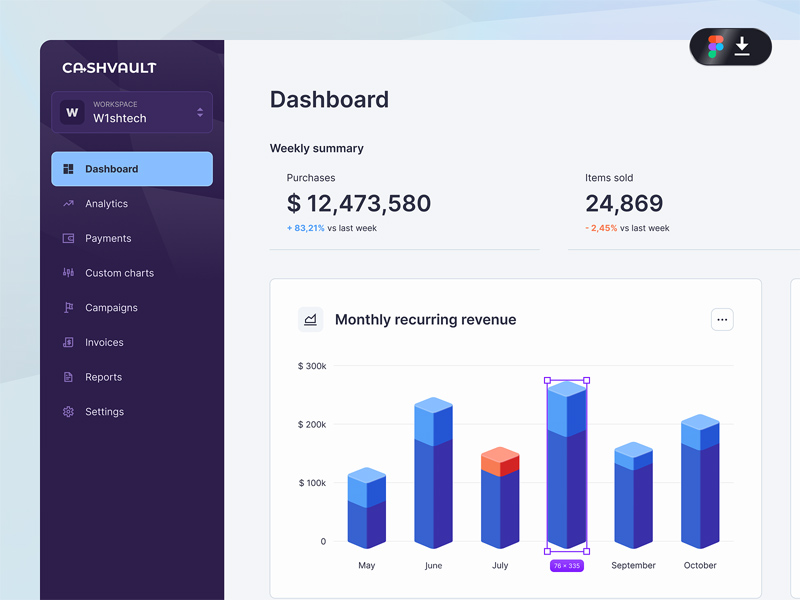
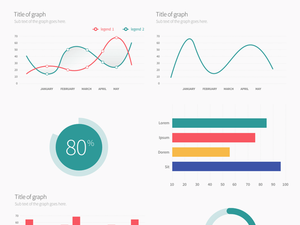
Introducing a valuable resource for designing graphs and visualizing data: a set of 3D bar charts. This collection of 3D bar charts offers a versatile tool for creating visually engaging graphs that can be seamlessly integrated into websites, applications, or presentation slides.
Crafted with precision and attention to detail, these 3D bar charts provide a dynamic way to present data, making it more accessible and understandable to the audience. Whether you're a web designer, app developer, or presenter, this resource can elevate the impact of your data visualization efforts.
Credit and appreciation go to Robert Zygmuntowski for generously sharing this Figma resource. By providing this set of 3D bar charts, Robert Zygmuntowski contributes to making the process of designing graphs more efficient and visually appealing.
Key features of this 3D bar chart resource may include:
- A variety of bar chart designs in 3D format, offering versatility for different data types and presentations.
- Attention-grabbing color schemes that enhance the visual appeal of the charts.
- Clear labeling and axis markers for easy data interpretation.
- Compatibility with Figma, a popular design tool for user interface and user experience (UI/UX) design.
To make use of this 3D bar chart resource:
- Download the Figma resource files provided by Robert Zygmuntowski.
- Open the files in Figma and explore the different 3D bar chart designs available.
- Customize the charts by inputting your own data, adjusting colors, labels, and other elements as needed.
- Ensure that the charts align with the design aesthetics and purpose of your project.
- Incorporate the finalized 3D bar charts into your websites, apps, or presentation slides.
By leveraging this set of 3D bar charts, you can enhance the visual impact of your data presentations and effectively convey information to your target audience. This resource provides a convenient solution for designers and presenters aiming to create compelling and informative graphs.


